
Enterprise Modelling
Cost Model
Reference Content ID: #LEAD-ES20013BCPG
Introduction to Cost Model
Cost Model is a structured method for quantifying how resources translate into products and outcomes. It creates a transparent view of cost drivers to support sound decisions.
It rests on traceability, consistency, and comparability: linking donate to activities, applying common rules, and enabling like-for-like evaluation across options.
Key components include cost objects and drivers; CapEx vs OpEx; fixed, variable, and step costs; unit economics and total cost of ownership. Scenarios expose trade-offs and sensitivities.
It applies enterprise-wide—IT, operations, supply chain, and shared services—scaling from product lines to corporate strategy and from greenfield to legacy estates.
Standardised data and workflows boost productivity, align teams, and reduce friction. Clear expectations support well-being and enable digital collaboration for on-site, hybrid, and remote teams.
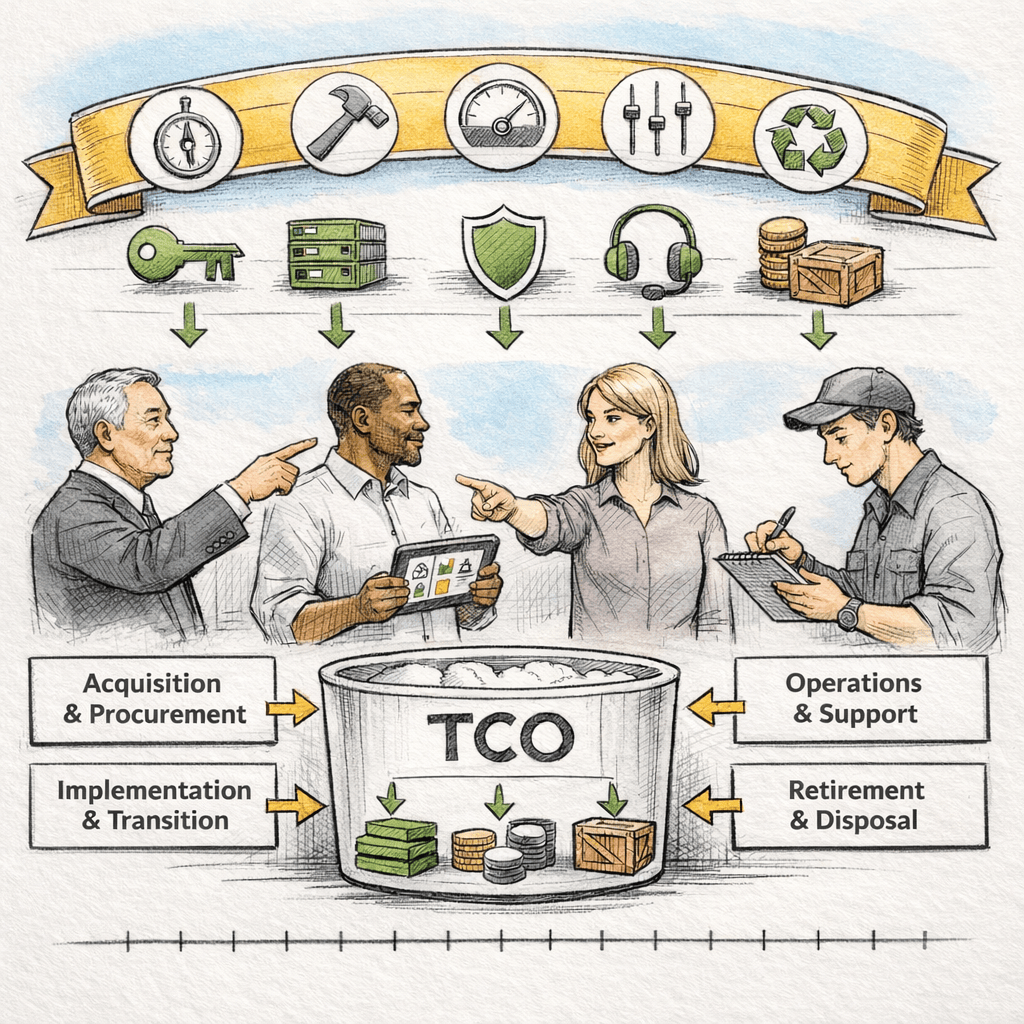
Definition and Scope
This subsection defines the Cost Model and clarifies its scope. A Cost Model links resources, activities, and outputs via cost drivers and allocation rules to quantify the cost of products, services, and capabilities.
It covers direct and indirect costs, CapEx and OpEx, fixed, variable and step costs, and total cost of ownership. It excludes pricing policy, statutory financial reporting, and non-financial benefit valuation.
Core domains are cost objects, pools, drivers, allocation bases, time horizons, and scenario/sensitivity logic. Data governance and chart-of-accounts mapping enable traceability and comparability.
In IT it spans infrastructure, applications, cloud, and labour; in operations, assets, throughput and service levels. Drivers push costs to objects; TCO integrates lifecycle effects. Applied consistently, the model standardises insight, accelerates decisions, and adapts to varied organisational and technological contexts.
Why Cost Model Matters
Cost Model enables credible financial decisions and operational focus. It translates spend into comparable unit economics for strategy execution under uncertainty.
Strategically, it aligns resources with outcomes, quantifies trade-offs, and stress-tests scenarios. As markets and technology shift—cloud, automation, AI—it provides a neutral basis to pivot portfolios.
Operationally, it resolves opaque allocations, shadow IT, runaway vendor or cloud costs, and inconsistent service pricing. Standardised drivers improve forecast accuracy, chargeback/showback, and accountability.
Stakeholders read it differently: executives gain capital discipline; managers get levers to optimise throughput and service levels; teams understand cost-to-serve and waste.
- Portfolio Reprioritisation: Shift funding from low-return to higher-ROI initiatives.
- Cloud Optimisation: Rightsize compute/storage using TCO and unit rates.
- Service Pricing: Set fair internal tariffs that shape behaviour.
The model converts complexity into actionable insight and measurable outcomes. It accelerates decisions, supports well-being through clarity, and sustains innovation at scale.
Business Case and Strategic Justification
A Cost Model underpins credible strategy execution. It gives leadership clear line-of-sight from spend to outcomes, enabling disciplined choices under budget pressure and market change.
It aligns with corporate objectives by linking investment to value creation, risk, and service levels. The model addresses opaque allocations, cloud overrun, and inconsistent internal pricing while surfacing opportunities in automation, sourcing, and portfolio rationalisation.
Return on investment is realised through lower run-costs, improved utilisation, and faster decisions. Typical targets include 5–15% OpEx reduction, 10–20% forecast-accuracy uplift, and payback within two to four quarters, measured via unit cost trends, TCO, and cost-to-serve.
Typical benefits include:
- Cost Transparency: Trace costs to services, products, and customers.
- Resource Reallocation: Shift funds from low to high ROI initiatives.
- Cloud Efficiency: Rightsize consumption using TCO and unit rates.
- Pricing Discipline: Set fair chargeback/showback to shape demand.
- Risk Control: Quantify cost impacts of availability and compliance.
Adopting the model strengthens governance and accelerates value delivery. Next steps: pilot a priority domain, baseline unit costs, and institutionalise data and ownership.
DON’T REINVENT THE WHEEL!
Get access to our Enterprise Standards to Drive Performance, Minimise Cost and Maximise Value.
How is Cost Model Used?
Cost Model is applied through a practical framework that combines method, guardrails, and exemplars. It embeds financial clarity into everyday decisions, converting spend data into actionable insights across products, services, and capabilities.
Three perspectives work in concert. Process stages define the end-to-end method—scope and data, driver design, unit-rate calculation, TCO analysis, and decision integration. Pitfalls highlight what to avoid—weak governance, poor data quality, misaligned drivers, and opaque allocations—so value is not eroded.
Exemplar practices translate experience into repeatable patterns and standards. The subsections that follow detail the method (Key Phases and Process Steps), surface risks and anti-patterns (Identifying Pitfalls and Challenges), and showcase proven approaches (Learning from Outperformers).
Together these perspectives provide sequence, safeguards, and standards. They enable consistent adoption, faster decisions, and measurable impact from the Cost Model.
Key Phases and Process Steps
The Cost Model is implemented through ten disciplined phases that turn raw spend into decision-grade insight. Each step builds traceability and comparability while minimising bias.
1. Purpose & Scope
Define objectives, boundaries, decision use cases.
2. Ownership & Governance
Assign roles, controls, cadence, change process.
3. Data Inventory
Catalogue sources; assess quality, granularity, gaps.
4. Cost Classification
Map to chart; CapEx/OpEx, fixed/variable, direct/indirect.
5. Cost Pooling
Group homogeneous costs for scalable allocation.
6. Driver Design
Select causal drivers; document rules and assumptions.
7. Allocation & Rates
Apply drivers; compute unit rates, cost-to-serve.
8. TCO & Lifecycle
Model run, change, risk, depreciation effects.
9. Scenario & Sensitivity
Test options, volumes, price/technology shifts.
10. Integration & Improvement
Embed in planning, chargeback, dashboards; iterate.
Following this sequence ensures reliable unit economics and total cost ownership views. The model becomes operational, auditable, and adaptable—supporting faster funding choices and continuous cost optimisation.
Identifying Pitfalls and Challenges: Antipatterns and Worst Practices
Cost models fail more from behaviour than math. Avoid these patterns that erode traceability, comparability, and trust.
5 Antipattern Examples:
5 Worst Practice Examples:
Build for decisions, not perfection. Govern data, document logic, and engage stakeholders to keep the model truthful, usable, and resilient.
Learning from Outperformers: Best Practices and Leading Practices
Outperformers treat Cost Model as a managed product and a decision engine. They combine rigorous governance with iterative adoption to drive measurable value.
5 Best Practice Examples:
5 Leading Practice Examples:
These practices convert data into trustworthy unit economics and faster decisions. Mature organisations institutionalise them across portfolios, sustaining cost discipline while enabling innovation.
Who is Typically Involved with Cost Model?
Clear role definition is essential to turn Cost Model from a finance exercise into a decision engine. Understanding who leads, who enables, and who consumes the outputs ensures accountability and sustained adoption.
Primary roles:
- Executive Sponsor: Sets ambition, secures funding, removes obstacles, and holds teams to outcome metrics.
- Cost Model Owner: Manages backlog, standards, and roadmap; aligns scope with business decisions and governs changes.
- Finance Lead: Ensures accounting integrity, designs drivers, validates rates, and reconciles to the ledger.
- Data & Tooling Lead: Curates data sources, metadata, and lineage; operates the platform, automation, and controls.
- Service/Process Owners: Provide consumption data, validate drivers, and use unit economics to optimise performance.
Stakeholder influence and benefits examples:
- Executives: Rebalance portfolios using unit ROI and TCO signals.
- Middle Management: Shape demand via showback/chargeback and capacity planning.
- Technical Teams & End Users: Target waste, rightsize cloud, and improve service levels.
Clear ownership, defined interfaces, and regular cadence create trust, speed decisions, and embed the Cost Model into daily management.
Where is Cost Model Applied?
Cost Model spans core corporate functions and delivery domains, tracing spend to outcomes in both legacy and digital contexts. It supports investment choices, pricing, and optimisation across products, services, and capabilities.
Primary domains and functions:
- Finance: Standardises cost classification, unit economics, and chargeback/showback for control and planning.
- IT & Cloud: Quantifies run, change, and risk; sets unit rates; guides optimisation and sourcing.
- Operations & Supply Chain: Links asset utilisation, throughput, and quality to cost-to-serve and service levels.
- Shared Services: Measures HR, facilities, and procurement efficiency; benchmarks and rightsizes demand.
- Customer Service & CX: Reveals contact drivers, channel mix costs, and impacts of automation.
Illustrative scenarios:
- Cloud Migration Roadmap: TCO and unit rates prioritise rehost, refactor, or retire decisions.
- Make-vs-Buy Assessment: Lifecycle costs compare internal capability to vendor alternatives.
These applications scale from team initiatives to enterprise portfolios. Common drivers create comparability across regions and business units, making Cost Model a shared language for planning and continuous improvement.
When Should You Embrace Cost Model?
Timing matters: the right moment amplifies impact, while poor timing stalls adoption. Cost Model delivers the most value when it is anchored to clear decisions and supported by readiness across people, data, and tooling.
Scenarios and conditions:
- Strategic Reset: Portfolio rebalancing or M&A demands comparable unit economics.
- Cloud & Tech Refresh: Migration or modernisation needs TCO and consumption transparency.
- Rapid Growth or Scale-Back: Volume shifts require elastic drivers and rate recalibration.
- Service Pricing Pressure: Internal tariffs or cost-to-serve under review need defensible rates.
- Regulatory or Risk Events: New compliance or resilience targets require lifecycle cost visibility.
Prerequisites:
- Executive Sponsorship: Clear mandate, funding, outcomes.
- Accountable Ownership: Named model owner and governance cadence.
- Decision Use Cases: Defined questions the model must answer.
- Reliable Data Foundations: Mapped sources, lineage, quality controls.
- Fit-for-Purpose Tooling: Automation for drivers, rates, and auditability.
Reading these signals and meeting prerequisites accelerates adoption, builds trust, and shortens time-to-value. The organisation gains a reusable decision engine for ongoing planning, pricing, and optimisation.
Most Common Cost Model Artefacts
The right artefacts turn Cost Model from theory into an operational discipline. They standardise definitions, preserve auditability, and accelerate decisions across teams. Below are the core working set used in most organisations:
- Cost Model Charter & Scope: States objectives, decision use cases, boundaries, and governance cadence.
- Cost Taxonomy & Mapping: Harmonises chart-of-accounts, CapEx/OpEx, and cost classes; enables traceability to services and products.
- Driver Catalogue & Allocation Rules: Defines causal drivers, data sources, calculation logic, and assumptions with version control.
- Unit Rate Card & Cost-to-Serve Matrix: Publishes service rates, unit economics, and consumption guidance for planning and pricing.
- TCO & Scenario Playbook: Models lifecycle costs and sensitivities; provides reusable scenarios for portfolio, sourcing, and cloud choices.
Together, these artefacts create a single source of truth, reduce rework, and make cost insights consumable. Maintaining them as living assets sustains comparability, speeds funding decisions, and embeds cost discipline in day-to-day management.
The Artefacts Table
This page provides a quick-reference view of the core artefacts used in Cost Model, what they are, and how they are applied. Use it to align stakeholders, standardise terminology, and accelerate decision-making across teams.
| Artefact | Description | Practical use |
|---|---|---|
| Cost Model Charter & Scope | Defines objectives, decision use cases, boundaries, success metrics, and governance cadence. | Aligns sponsors and owners, frames pilots and releases, and keeps the model purpose-led. |
| Cost Taxonomy & Mapping | Harmonises chart-of-accounts, CapEx/OpEx, and cost classes to enable consistent classification and lineage. | Connects ledger entries to services and products for traceable reporting and planning. |
| Driver Catalogue & Allocation Rules | Documents causal drivers, data sources, formulas, and assumptions with version control. | Delivers repeatable, auditable allocations and simplifies updates as volumes and prices change. |
| Unit Rate Card & Cost-to-Serve Matrix | Publishes service unit costs and consumption guidance for portfolios, products, and teams. | Informs budgeting and pricing, enables showback/chargeback, and helps shape demand. |
| TCO & Scenario Playbook | Models lifecycle costs and sensitivities across options, volumes, and technology choices. | Supports investment cases, cloud optimisation, make-versus-buy, and capacity decisions. |
Together these artefacts create a single source of truth that turns spend data into decision-grade insight. Maintaining them as living assets sustains comparability, speeds funding choices, and embeds cost discipline in day-to-day management.