
Enterprise Information & Technology
IT Process Map
Reference Content ID: #LEAD-ES50003BP
Introduction to IT Process Map
The IT Process Map provides a structured framework that defines, standardises, and visualises all core IT processes across an organisation. It clarifies how IT functions interconnect, from strategy and service design to operations and continuous improvement.
By offering clear process transparency, it enables consistent execution and governance across teams. Applicable to enterprises of all sizes and industries, it enhances productivity, collaboration, and digital workflow integration across on-site, hybrid, and remote environments.
Ultimately, the IT Process Map empowers organisations to align IT operations with business objectives, optimise resources, and support employee well-being through clarity, efficiency, and shared accountability.
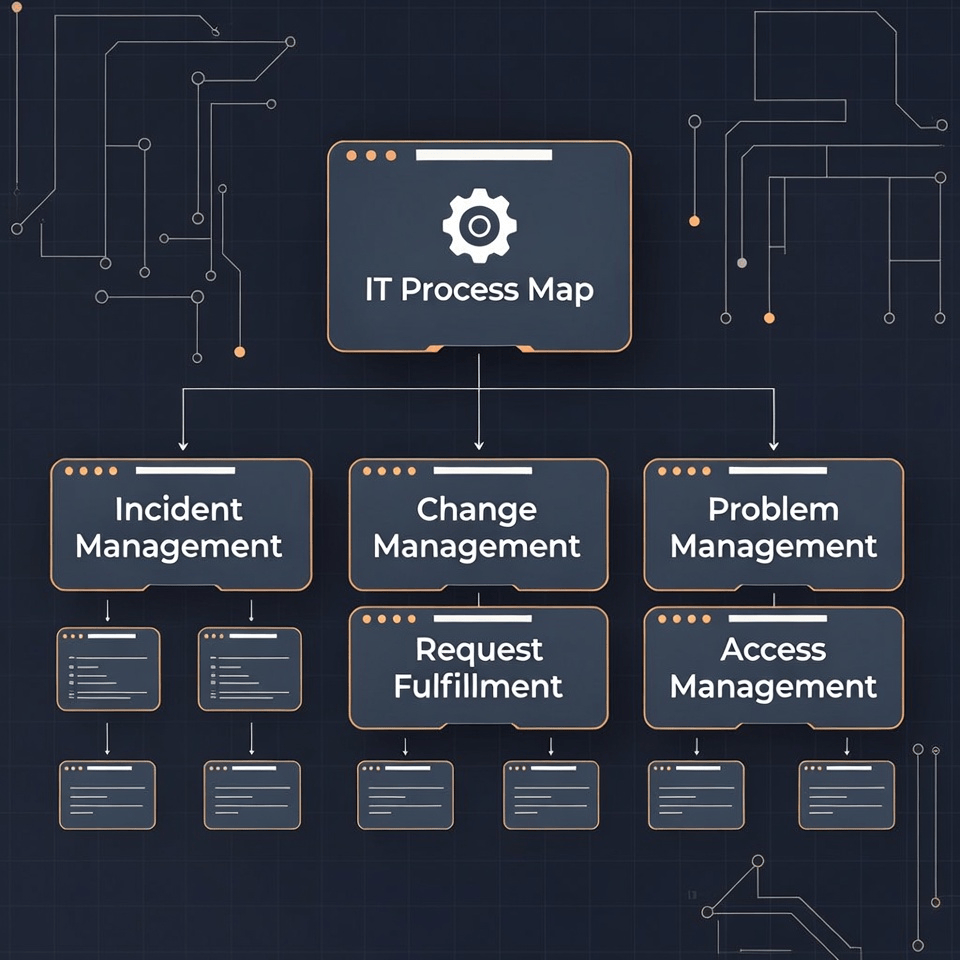
Definition and Scope
The IT Process Map defines the complete landscape of IT management processes, providing a visual and logical representation of how technology services are planned, delivered, and maintained. It integrates frameworks such as ITIL, COBIT, and ISO standards to ensure consistency, control, and alignment with business objectives.
Its primary components—strategy, design, transition, operation, and continual improvement—form a cohesive system that drives efficiency and accountability. While it covers all process interactions within IT, it excludes detailed tool configurations or vendor-specific implementations. Ultimately, the IT Process Map establishes a unified process view that bridges organisational silos, strengthens governance, and supports seamless technology-enabled collaboration.
Why IT Process Map Matters
The IT Process Map is vital for aligning technology operations with business strategy, ensuring that IT investments directly support organisational goals. It provides a structured approach to manage complexity, streamline decision-making, and adapt to rapid market or technological change. Executives, managers, and end users each benefit from its clarity and consistency.
- Strategic Alignment: Ensures IT initiatives deliver measurable business outcomes.
- Operational Efficiency: Reduces redundancy and accelerates process execution.
- Innovation Enablement: Creates a foundation for continuous improvement and digital transformation.
By connecting strategic vision with daily operations, the IT Process Map strengthens agility, transparency, and long-term value creation across the enterprise.
Business Case and Strategic Justification
The business case for IT Process Map rests on its ability to transform fragmented IT operations into a coherent, value-driven system. By aligning IT activities with corporate goals, it addresses challenges such as inefficiency, poor visibility, and inconsistent service delivery while enabling scalability and compliance. The return on investment is achieved through reduced operational costs, improved resource utilisation, faster delivery cycles, and measurable service quality improvements.
Typical benefits of IT Process Map include:
- Process Transparency: Clarifies roles, responsibilities, and workflows across IT.
- Efficiency Gains: Eliminates duplication and accelerates service execution.
- Quality Assurance: Strengthens governance and compliance with standards.
- Decision Support: Provides reliable data for strategic IT management.
- Continuous Improvement: Establishes a culture of optimisation and learning.
IT Process Map justifies itself as a strategic enabler that enhances performance, accountability, and innovation across the enterprise.
DON’T REINVENT THE WHEEL!
Get access to our Enterprise Standards to Drive Performance, Minimise Cost and Maximise Value.
How is IT Process Map Used?
The IT Process Map is applied as a structured framework that guides organisations through designing, executing, and optimising their IT operations. It provides three core perspectives that ensure balanced implementation: process stages, pitfalls to avoid, and exemplar practices to follow.
- The Key Phases and Process Steps define how processes progress from planning to continuous improvement.
- Identifying Pitfalls and Challenges helps organisations recognise and prevent recurring failures.
- Learning from Outperformers showcases proven approaches and innovations from leading practitioners.
Together, these perspectives ensure that IT Process Map becomes a practical tool for achieving efficiency, quality, and strategic alignment in real-world environments.
Key Phases and Process Steps
The IT Process Map follows a structured ten-phase approach that ensures IT operations are aligned, efficient, and continuously improving. Each phase represents a key step in managing the lifecycle of IT services and processes.
1. Strategy Definition
Establishes IT goals aligned with business objectives.
2. Demand Management
Identifies and prioritises IT needs and opportunities.
3. Service Design
Develops service models, architectures, and governance standards.
4. Process Modelling
Maps workflows, roles, and dependencies across functions.
5. Implementation Planning
Defines resources, timelines, and deployment strategies.
6. Execution & Delivery
Operates services to meet agreed performance targets.
7. Monitoring & Control
Tracks performance using KPIs and compliance metrics.
8. Incident & Problem Management
Restores stability and prevents recurrence.
9. Performance Optimisation
Improves efficiency and user experience.
10. Continual Improvement
Embeds learning and innovation into the IT ecosystem.
Together, these phases create a repeatable framework that ensures consistency, transparency, and measurable value delivery.
Identifying Pitfalls and Challenges: Antipatterns and Worst Practices
Implementing an IT Process Map can fail when organisations overlook governance, misapply frameworks, or focus too narrowly on tools. Recognising and avoiding common antipatterns and worst practices helps ensure sustainable success.
5 Antipattern Examples:
5 Worst Practice Examples:
Avoiding these pitfalls ensures the IT Process Map remains relevant, efficient, and value-driven.
Learning from Outperformers: Best Practices and Leading Practices
Outperforming organisations apply the IT Process Map as a living framework that evolves with business needs. They focus on integration, measurement, and continuous improvement to maximise value creation.
5 Best Practice Examples:
5 Leading Practice Examples:
Adopting these practices ensures the IT Process Map drives resilience, innovation, and long-term operational excellence.
Who is Typically Involved with IT Process Map?
Successful implementation of the IT Process Map depends on clear role definition and collaboration across organisational levels. Each participant contributes unique expertise to ensure effective design, execution, and governance.
Primary roles typically involved include:
- Executive Sponsor: Provides strategic direction and secures organisational commitment.
- Process Owner: Oversees design, compliance, and continuous improvement.
- Project Lead: Manages implementation, timelines, and stakeholder coordination.
- Operations Manager: Ensures alignment with daily IT service delivery.
- Process Analyst: Documents, analyses, and optimises process performance.
Stakeholder engagement benefits include:
- Executives: Gain transparency and governance control.
- Managers: Improve decision-making through reliable data.
- Technical Teams: Achieve clarity on roles and workflow dependencies.
Clearly defined responsibilities enhance accountability, communication, and sustained process excellence.
Where is IT Process Map Applied?
The IT Process Map is applied across multiple organisational domains to standardise workflows, enhance collaboration, and align IT services with business objectives. Its flexibility allows adaptation to diverse operational and strategic contexts.
Common application areas include:
- IT Operations: Streamlines incident, change, and service management.
- Finance: Supports budgeting, cost control, and IT asset management.
- Human Resources: Aligns workforce planning with digital service needs.
- Customer Service: Improves response times and service quality.
- Project Management: Enhances coordination, delivery, and governance.
Illustrative scenarios include:
- Digital Transformation Initiatives: Unifying legacy and cloud-based processes.
- Compliance Programmes: Embedding regulatory standards in daily operations.
Its adaptability ensures relevance across industries, functions, and organisational maturity levels.
When Should You Embrace IT Process Map?
The timing of adopting an IT Process Map is critical to maximise its impact and ensure sustainable results. Organisations should introduce it when strategic alignment, operational readiness, and leadership support are in place.
Key scenarios for adoption include:
- Rapid Growth: Scaling IT operations to match business expansion.
- Digital Transformation: Reengineering workflows for technology integration.
- Process Inefficiency: Addressing fragmentation and inconsistent delivery.
- Regulatory Change: Ensuring compliance through structured governance.
- Organisational Restructuring: Harmonising processes after mergers or reorganisations.
Essential prerequisites include:
- Executive Sponsorship: Strong leadership support to ensure direction, authority, and funding.
- Stakeholder Commitment: Active engagement from all relevant business and IT participants.
- Skilled Process Teams: Competent professionals to design, implement, and maintain the process framework.
- Defined IT Processes: A foundational level of process documentation and standardisation.
- Resource Availability: Sufficient time, budget, and tools to support successful execution.
When implemented under the right conditions, IT Process Map becomes a catalyst for efficiency, transparency, and continuous improvement.
Most Common IT Process Map Artefacts
The effectiveness of an IT Process Map depends on the artefacts and tools that translate strategy into actionable processes. These artefacts provide structure, traceability, and a shared understanding across IT and business teams.
Common artefacts and tools include:
- Process Framework Document: Defines process structures, objectives, and interdependencies.
- RACI Matrix: Clarifies roles, responsibilities, and accountabilities across stakeholders.
- Process Flow Diagrams: Visualise workflows and decision points for clarity and improvement.
- Performance Dashboards: Track KPIs and monitor service quality in real time.
- Continuous Improvement Log: Captures lessons learned and prioritised optimisation actions.
Together, these artefacts ensure consistency, transparency, and continuous enhancement of IT operations within the process landscape.
The Artefacts Table
The table summarises the core artefacts that operationalise an IT Process Map. Each entry states its purpose and shows how teams apply it day to day.
| Artefact | Description | Practical use |
|---|---|---|
| Process Framework Document | Defines process structures, objectives, policies, and interdependencies. | Guides programme setup, audits, and onboarding with a single source of truth. |
| RACI Matrix | Clarifies who is Responsible, Accountable, Consulted, and Informed. | Removes ambiguity during changes, incidents, and cross-team initiatives. |
| Process Flow Diagrams | Visualise end-to-end workflows, decisions, and handoffs. | Support redesign workshops, automation scoping, and training materials. |
| Performance Dashboards | Track KPIs and SLAs to monitor service health. | Enable weekly reviews, early risk detection, and prioritised actions. |
| Continuous Improvement Log | Captures lessons learned and ranked enhancements. | Feeds sprint backlogs and quarterly improvement roadmaps. |
Together, these artefacts create shared understanding, measurable control, and a cadence of improvement. They help teams standardise work, resolve issues faster, and align IT effort with business outcomes.